Accuracy and precision
Delivering the highest resolution, market leading data where available, modelled in-house by our data experts.
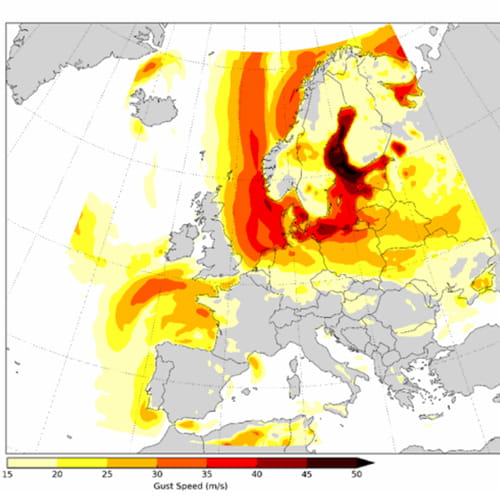
Visualise and assess any natural hazard anywhere in the world
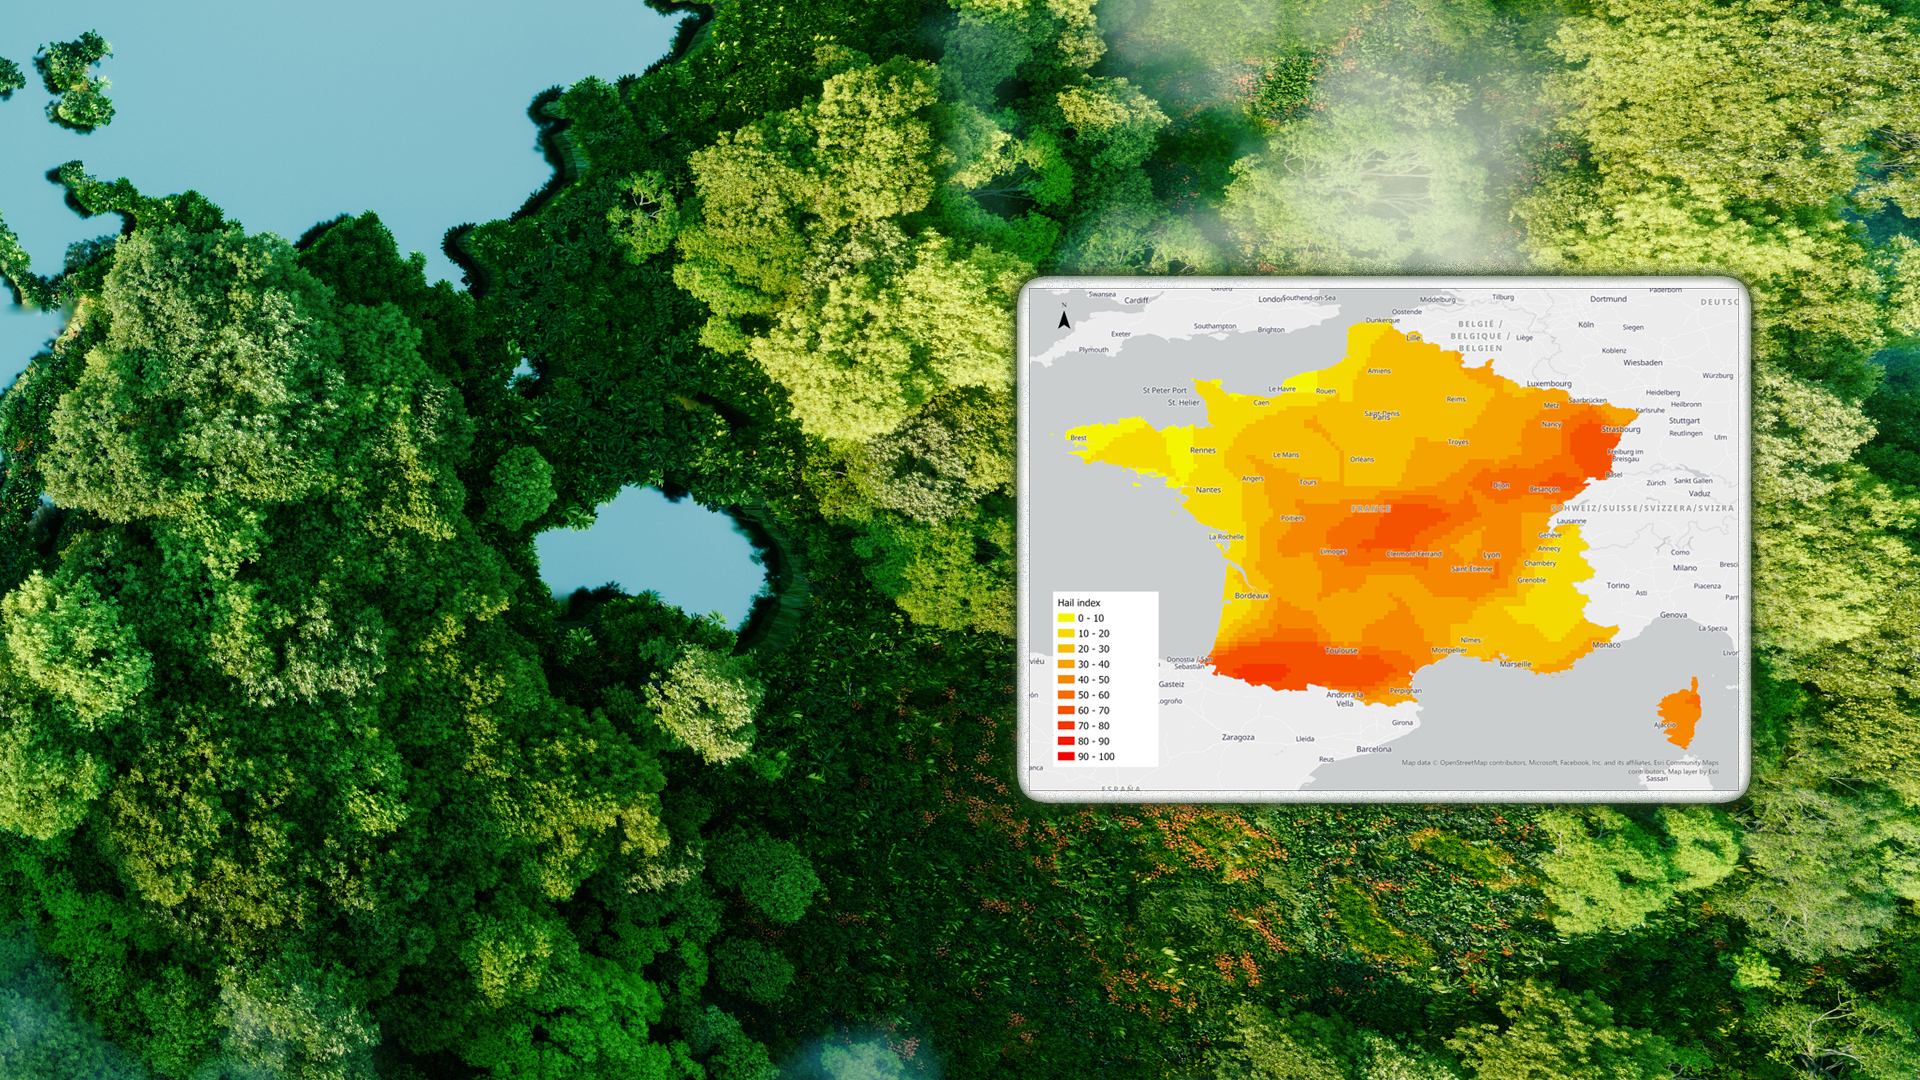
Hazard Maps in brief
The more accurate picture of risk we now have will enable us to decide at the individual property level where we do and don’t want offer insurance cover and ensure that we are only taking on acceptable risks.